- English (UK)
- English (India)
- English (Canada)
- English (Australia)
- English (South Africa)
- English (Philippines)
- English (Nigeria)
- Deutsch
- Español (España)
- Español (México)
- Français
- Italiano
- Nederlands
- Polski
- Português (Portugal)
- Português (Brasil)
- Русский
- Türkçe
- العربية
- Ελληνικά
- Svenska
- Suomi
- עברית
- 日本語
- 한국어
- 简体中文
- 繁體中文
- Bahasa Indonesia
- Bahasa Melayu
- ไทย
- Tiếng Việt
- हिंदी
Gubra AS (GUBRA)
Gubra AS stock price live, this page displays CSE GUBRA stock exchange data. View the GUBRA premarket stock price ahead of the market session or assess the after hours quote. Monitor the latest movements within the Gubra AS real time stock price chart below.
What Is the Gubra AS Stock Price Today?
The Gubra AS stock price today is 344.60.
What Is the Stock Symbol for Gubra AS?
The stock ticker symbol for Gubra AS is GUBRA.
Is GUBRA the Same as $GUBRA?
$GUBRA is a common way to refer to the Gubra AS ticker symbol in social media, forums, and online discussions. The dollar sign is a shorthand convention used to indicate that it is a stock ticker symbol
What Stock Exchange Does Gubra AS Trade On?
Gubra AS is listed and trades on the Copenhagen stock exchange.
Is Gubra AS a Good Stock to Buy?
Determining whether Gubra AS—or any stock—is a good buy requires comprehensive analysis. To evaluate its potential, users can sign up to InvestingPro, where they can assess the current Gubra AS share price compared with the fair value and other essential metrics.
You can find more details by visiting the additional pages to view historical data, charts, latest news, analysis or visit the forum to view opinions on the GUBRA quote. (ISIN: DK0062266474)
344.60
+8.60(+2.56%)
Closed·
Fair Value
An estimate of a stock's true price based on valuation models like discounted cash flow, peer valuation multiples, and dividend discount models.
Day's Range
336.00
347.80
52 wk Range
293.00
571.00
High dividend Yield
1/2
Fair Value
An estimate of a stock's true price based on valuation models like discounted cash flow, peer valuation multiples, and dividend discount models.
Day's Range
336.00347.80
52 wk Range
293.00571.00
Key Statistics
Edit
Prev. Close
Open
Volume
Average Vol. (3m)
1-Year Change
Book Value / Share
Fair Value
Fair Value Upside
Market Cap
Shares Outstanding
Revenue
Net Income
EPS
EPS Growth Forecast
Next Earnings Date
(18.21%)
Dividends Payment Streak
P/E Ratio
Return on Assets
Return on Equity
Gross Profit Margin
Price/Book
EBITDA
EV/EBITDA
Beta
GUBRA Scorecard
Company’s Health
Assesses a company's financial position by analyzing its market value, financial ratios, industry benchmarks, and competitors.
UnlockFair Value
An estimate of a stock's true price based on valuation models like discounted cash flow, peer valuation multiples, and dividend discount models.
Unlock PriceTechnical Analysis
Strong Sell
Price Target
469.50
Upside
+36.24%
Members' Sentiments
Bearish
Bullish
ProTips
Tips that distill complex financial data into concise, actionable investment insights.
Valuation implies a strong free cash flow yield
Technical Analysis
Summary
Strong Sell
Sell
Neutral
Buy
Strong Buy
Strong Buy
Technical Indicators
Strong Buy
Moving Averages
Buy
Gubra A/S, a disease-agnostic techbio company, focuses on the peptide-based drug discovery and preclinical contract research services in Europe, North America, and internationally. It operates through three segments: Preclinical Contract Research (CRO), Biotech, and Gubra Green. The company offers preclinical contract research and development services within metabolic and fibrotic diseases for the pharmaceutical and biotechnology industry; and various services in vivo pharmacology, biomarker assays, bioinformatics, next gen sequencing, bioinformatics, and 2D and 3D histology with artificial intelligence pathology. It also has a portfolio strategy of potential drug candidates in the form of upfront payments, research payments, milestone payments, and royalties; and investments targeting as sets promoting the green transition. The company has partnership and collaboration with Boehringer Ingelheim for the treatment of obesity; Camurus’ FluidCrystal technology to develop a therapy for hypoparathyroidism; Amylyx Pharmaceuticals to develop a GLP-1 receptor antagonist for post-bariatric hypoglycemia and other rare diseases. Gubra A/S was incorporated in 2008 and is headquartered in Horsholm, Denmark.
Gubra AS Earnings Call Summary for Q4/2025
- Gubra AS posted record 2025 results with DKK 2.6B revenue and DKK 1.7B net profit, driven by landmark AbbVie outlicensing deal upfront payment.
- Stock surged 13.88% post-announcement, nearing 52-week high; company paid DKK 1B dividend while maintaining strong liquidity position.
- Company projects 10-15% CRO segment growth in 2026 despite expected margin compression from investments in new disease areas and clinical programs.
- Management plans increased spending on UCN2 clinical trials; U.S. market challenges persist affecting smaller biotech client segment.
- CEO termed AbbVie agreement 'transformative,' validating outlicensing model and setting new benchmark for strategic partnerships going forward.
Last Updated: 02/27/2026, 06:10 AM
Read Full TranscriptGubra AS investor slides for Q4/2025
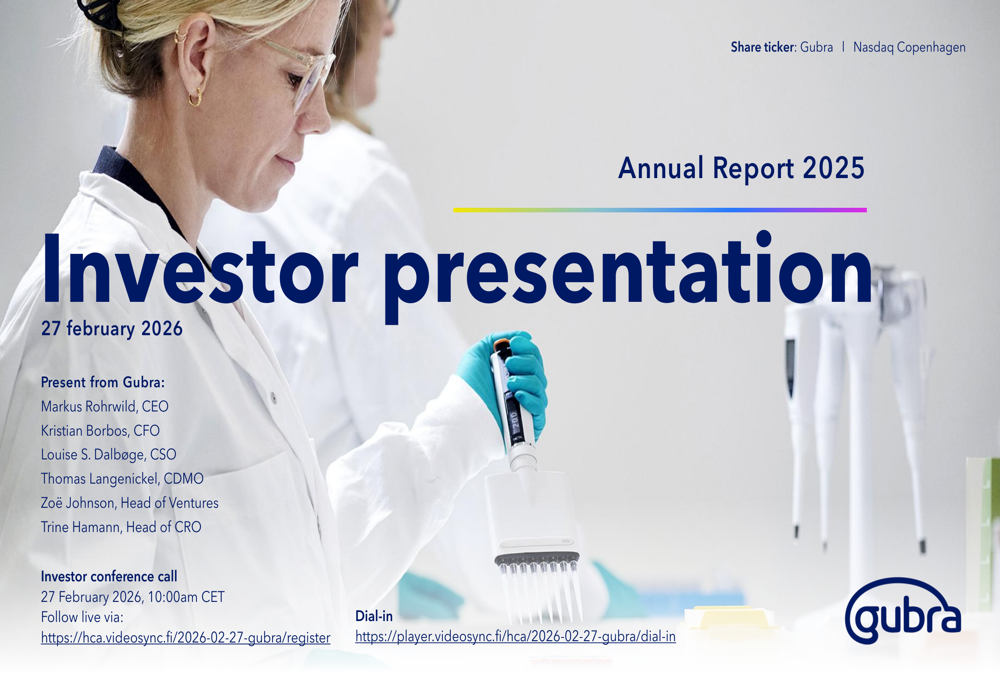
Last Update: Feb 27, 2026
See full investor slides
Compare GUBRA to Peers and Sector
Metrics to compare | GUBRA | Sector Sector - Average of metrics from a broad group of related Healthcare sector companies | Relationship RelationshipGUBRAPeersSector | |
|---|---|---|---|---|
P/E Ratio | 3.3x | −11.3x | −0.5x | |
PEG Ratio | 0.00 | 0.04 | 0.00 | |
Price / Book | 4.9x | 1.5x | 2.6x | |
Price / LTM Sales | 2.1x | 4.5x | 3.2x | |
Upside (Analyst Target) | 37.0% | 27.0% | 45.7% | |
Fair Value Upside | Unlock | 15.4% | 4.8% | Unlock |
Analyst Ratings
1 Buy
1 Hold
0 Sell
Ratings:
2 analysts
Overall Consensus
Buy
Analysts 12-Month Price Target:
Average 469.50
(+36.24% Upside)
Earnings
Latest Release
Feb 27, 2026
EPS / Forecast
-4.45 / --
Revenue / Forecast
46M / 72M
People Also Watch
FAQ
What Is the Gubra AS (GUBRA) Stock Price Today?
The Gubra AS stock price today is 344.60 DKK.
What Stock Exchange Does Gubra AS Trade On?
Gubra AS is listed and trades on the Copenhagen Stock Exchange.
What Is the Stock Symbol for Gubra AS?
The stock symbol for Gubra AS is "GUBRA."
Does Gubra AS Pay Dividends? What’s The Current Dividend Yield?
The Gubra AS dividend yield is 18.21%.
What Is the Gubra AS Market Cap?
As of today, Gubra AS market cap is 5.63B DKK.
What Is Gubra AS's Earnings Per Share (TTM)?
The Gubra AS EPS (TTM) is 102.70.
When Is the Next Gubra AS Earnings Date?
Gubra AS will release its next earnings report on May 06, 2026.
From a Technical Analysis Perspective, Is GUBRA a Buy or Sell?
Based on moving averages and other technical indicators, the daily buy/sell signal is Strong Sell.
How Many Times Has Gubra AS Stock Split?
Gubra AS has split 0 times.
How Many Employees Does Gubra AS Have?
Gubra AS has 300 employees.
What is the current trading status of Gubra AS (GUBRA)?
As of Apr 16, 2026, Gubra AS (GUBRA) is trading at a price of 344.60 DKK, with a previous close of 344.60 DKK. The stock has fluctuated within a day range of 336.00 DKK to 347.80 DKK, while its 52-week range spans from 293.00 DKK to 571.00 DKK.
What Is Gubra AS (GUBRA) Price Target According to Analysts?
The average 12-month price target for Gubra AS is 469.50 DKK, with a high estimate of 510 DKK and a low estimate of 429 DKK. 1 analysts recommend buying the stock, while 0 suggest selling, leading to an overall rating of Buy. The stock has an +36.24% Upside potential.
Install Our App
Risk Disclosure: Trading in financial instruments and/or cryptocurrencies involves high risks including the risk of losing some, or all, of your investment amount, and may not be suitable for all investors. Prices of cryptocurrencies are extremely volatile and may be affected by external factors such as financial, regulatory or political events. Trading on margin increases the financial risks.
Before deciding to trade in financial instrument or cryptocurrencies you should be fully informed of the risks and costs associated with trading the financial markets, carefully consider your investment objectives, level of experience, and risk appetite, and seek professional advice where needed.
Fusion Media would like to remind you that the data contained in this website is not necessarily real-time nor accurate. The data and prices on the website are not necessarily provided by any market or exchange, but may be provided by market makers, and so prices may not be accurate and may differ from the actual price at any given market, meaning prices are indicative and not appropriate for trading purposes. Fusion Media and any provider of the data contained in this website will not accept liability for any loss or damage as a result of your trading, or your reliance on the information contained within this website.
It is prohibited to use, store, reproduce, display, modify, transmit or distribute the data contained in this website without the explicit prior written permission of Fusion Media and/or the data provider. All intellectual property rights are reserved by the providers and/or the exchange providing the data contained in this website.
Fusion Media may be compensated by the advertisers that appear on the website, based on your interaction with the advertisements or advertisers.
© 2007-2026 - Fusion Media Limited. All Rights Reserved.